Upcoming blockbusters could boost movie chain stocks

I have to admit that one of my guilty pleasures is watching movies on a big movie screen. My wife and I really enjoy science fiction and superhero type movies. We see anywhere from 10 to 15 movies every year. Sometimes we will even see the same movie more than once.

2017 has been a rough year for the film industry, with the North American box office suffering its lowest-grossing summer in 25 years. Ticket sales are down 10.8 percent this summer and have decreased by nearly 3 percent year to date. Box office flops such as “The Mummy” and “Baywatch” have hurt Hollywood but there will be some upcoming movies this year that could turn into blockbusters.

Release dates in November and December of 2017 include Thor: Ragnarok, Justice League and my personal favorite Star Wars: The Last Jedi.  Upcoming movies in 2018 appears to be very strong with:

  • Black Panther
  • X-Men: The New Mutants
  • Avengers: Infinity War
  • Han Solo,
  • Deadpool 2 
  • Ant-man & The Wasp.

However, investors have really punished the movie chain stocks. U.S. chains, Regal Entertainment (RGC) and Cinemark (CNK) are down 35% & 25% respectfully over the past 6 months. Cineplex (CGX) the largest Canadian chain is also down 25%, see chart below:

The vast majority of theaters in the U.S. keep a larger percentage of the ticket sales the longer the film is in the theater. For example: opening weekend they may get 10%, the 4th  week up to 25% and the 10th  week up to 50% or more. While concessions account for only about 20% of gross revenues, they represent about 40% of theaters’ profits. Profit margins on soda and popcorn average 85 percent.

All three of these stocks pay dividends, Regal has the highest yield of 5.7% followed by Cineplex at 4.35% and Cinemark with 3.43%. I expect that their 3rd quarter results could disappoint which would be a good buying opportunity. However, there is a risk that the price of these stocks could move up in anticipation of better future earnings.

Possible ways to trade a rebound in movie chain stocks

  1. Take a half position now and buy the other half after 3rd quarter earnings are released
  2. Buy a full position near the ex-dividend date, to get paid while you wait
  3. Buy half position, sell covered calls and sell cash secured puts for the other half.
  4. Buy some long calls near 4th quarter earnings release scheduled for Feb. 2018

Being an option trader, I am going to wait until Feb 2018 options are available. If the VIX which measures volatility stays low, I will probably buy a call option on one or two of these stocks.


Disclaimer: This post is for discussion purposes, do your own research.

A big disconnect between the Stock Market and the Canadian Economy

Canada’s economy is expanding at its fastest annualized rate in six years according to Statistics Canada. That’s a quarterly expansion rate of 4.5% which is the highest figure since the third quarter of 2011. It was led by the biggest binge in household spending since before the 2008-2009 global recession.

Economists had predicted Canada to grow around 3.7% and the Bank of Canada latest forecast was for GDP to expand at 3% in their July press release. When combined with the 3.7% expansion of the first quarter, it’s the strongest six month start in 15 years.

Why isn’t money pouring into the Toronto Stock Market?

Often times the equity market is moving well before the economy does and of course the Canadian equity market had a robust year in 2016. Investors may already have priced in all the good news last year, when Canada’s stock index gained 18 percent, one of the world’s best performances.

Part of the problem is that Canada’s stock market isn’t totally reflective of the economy, since it’s heavily reliant on energy and financials. Those two sectors account for 54 percent of the S&P/TSX Composite Index.

The outlook for oil is very subdued, it is still trading below $50 a barrel even with the shutdown of refineries due to hurricane Harvey. Global inventories continue to stay high and OPEC’s has lost its influence in cutting production. Crude oil prices in the future’s market are still below $50 a barrel for all of 2018 and part of 2019. Foreign investors are taking money out of the Alberta’s oil patch.

Continued growth in residential investments which was up an annualized 16 percent in the first quarter is also likely to fade as the impact of government measures to cool housing markets kick in. Although, bank earnings have beat expectations by a wide margin, loan growth going forward is expected to decline and loan losses are expected to increase. U.S. hedge funds are still shorting Canadian financials expecting the housing bubble to burst.

Investors believe that this robust growth will force the Bank of Canada to continue raising interest rates this year. It could add extra pressure to lowering consumer spending due to high indebtedness of Canadian households. It will also add a cooling effect to the hot housing prices in both the Vancouver and Toronto real estate markets. The rapid rise in the value of the Canadian dollar is added proof that currency traders are betting that a hike in interest rates is coming soon.

Uncertainty over NATFA  renegotiation

Global political developments aren’t helping, with renegotiation of the North American Free Trade Agreement which started in August, created a new spat with the U.S. erupting over aerospace manufacturing.

Already, data suggest investment into the country is cooling. Foreign direct investment in Canada dropped 25 percent to C$8.68 billion in the first quarter, according to separate data released Tuesday. The country relies heavily on foreign funding to finance spending — totaling C$130 billion over the past two years, according to balance of payment data.

Canada has benefited from a convergence of developments that include a coordinated global recovery and rising trade volumes. The bottoming of the oil shock in western Canada, along with federal deficit spending, rising industrial production in developed economies. Canadian consumers have benefited from a buoyant jobs market and rising home values, resulting in a surge in consumer spending.

Is this Sustainable? I think not!

Economists had been predicting a slowdown in growth to about 2 percent in the second half of this year, but are revising numbers up after the GDP report. I believe this surge in economic growth is temporary. The higher value of the Canadian dollar and higher interest rates will dampen economic growth.

The Toronto stock market returns for all of 2017 are flat which could indicate that foreign investors also believe the future going forward isn’t so rosy!


Why you should look under the ETF’s hood

A fund’s name might seem like a good starting point for gaining an initial understanding of how it is constructed. Unfortunately, names turn out to offer little help for evaluating funds. There is simply no universally accepted system in use by ETF providers and research to classify funds. For example “Infrastructure” would seem to have something to do with the amenities, roads and power supplies needed to operate society.

Names can be deceiving! To illustrate, I went to one of my favorite ETF provider’s web site to look under the hood. I was looking to find some discrepancies. It took some time but the geographic allocation in the fact sheet on the BMO Global Infrastructure Index ETF (ZGI) wasn’t global at all but had the majority of their holdings in North America.

  • 66.02% United States
  • 25.16% Canada
  • 6.71% United Kingdom
  • 1.56% Mexico
  • 0.56% Brazil

The top ten holdings also have a lot of pipeline companies who pay construction companies to build the actual  infrastructure.

  • Enbridge 10.07%
  • American Tower Corp 8.82%
  • National Grid Plc 6.71%
  • TransCanada Corp 6.68%
  • Crown Castle Intl Corp 6.07%
  • Kinder Morgan 5.87%
  • P G & E Corp 5.17%
  • Sempra Energy 4.25%
  • Williams Cos 96%
  • Edison International 3.82%

It takes years for pipeline companies to benefit from any new capacity to come on line. On the other hand, companies who specialize in construction & engineering like SNC-Lavalin or Aecon would see immediate revenue growth. I would recommend looking for another infrastructure ETF that had more global exposure with holdings of construction & engineering type companies.

Another example is the BMO S&P/TSX Equal Weight Industrials Index ETF (ZIN) which has a small discrepancy. The fact sheet says it has 26 industrial holdings but two of those holdings include airlines. (Air Canada 5.46% & Westjet 4.13%)  Now both of these companies buy industrial products but they specialize in transportation.

Here are some key steps all investors should take when evaluating ETFs:

  1. First, decide if you are going to be a do-it-yourself investor or work with an advisor. As their name suggests, ETFs are traded on exchanges, so they can be bought and sold like stocks through a discount brokerage.
  2. Make sure you understand the index underlying the ETF you are considering. Focus on how the index is constructed, what it tracks and how long it has been around. A longer record will reveal how the index responded to different market conditions.
  3. Check the fund’s fact sheet, are the underlying holdings and geographic allocation accurate? How does the exchanged traded fund compare with similar funds from other providers?
  4. Avoid ultra-short and leveraged ETFs, leave those to professional traders.

Ultimately, the proper implementation of ETFs in a portfolio requires, like all investment decisions, due diligence, caution and persistence. ETFs can offer many attractive features but their long-term value depends on how well they fit into an individual’s portfolio.

To evaluate an appropriate fit, investors have to be prepared to look under the hood.


How has the Trump circus effective your investments?

As a Canadian, I think that the Washington circus is no longer funny. It has become “very scary”. We came very close to a nuclear war. Tensions regarding North Korea have lessen temporarily and the market sell off could have been a lot worse. So far, investors have ignored the noise coming out of Washington as U.S. corporate earnings have been better than expected.

Canadian and European investors with holdings in U.S. dollars have seen their investment returns reduced by the falling value of the U.S. dollar. For example, my investment club’s U.S. portfolio is up 10.2% as of the end of July. However, it is up only 2.3% when converted into Canadian dollars. The value of the Euro is also up 10% compared to the U.S. dollar.

The recent rally in gold is another sign of a weakening value of the U.S. dollar. A falling dollar not only increases the value of other currencies, it also increases the demand for commodities like gold. Investors buy gold as a hedge against a further weakening of the U.S. dollar.

American investors with holdings outside of the U.S. have benefited the most from a weaker dollar. Corporations that generate revenue outside the U.S. will get an earnings boost from foreign profits.   Keep in mind that the bond market doesn’t believe the Trump growth agenda will get passed any time soon. The yield on 10 year treasuries has fallen back to pre-election lows. Returns in U.S. bond portfolios have been positive for American investors.

Biggest Market Risks

  1. More inflammatory tweets from Trump regarding North Korea
  2. The resignation of Trump’s key economic advisors, Gary Cohn and Steven Mnuchin
  3. The Fed increasing short term rates causing an inverted yield curve which historically causes a U.S. recession.
  4. In fighting within the Republican Party continues and they are unable to pass meaningful economic fiscal policy.
  5. Trump’s desperation for a win causes him to tear up the NAFTA agreement?

I find this very disturbing:

President Trump’s approval rating is at its lowest since he took office with only 35% of Americans giving him a positive rating, according to a Marist Poll released Wednesday.

Although he is still popular among Republicans, his key constituency, his job performance rating has dropped among strong Republicans from 91% in June to 79% now.

Hard to believe that 79% of Republicans still approve of President Trump!

Lets hope that American voters will come to their senses during the 2018 elections!!

Risk Tolerance Questionnaire

Take a piece of paper and write down the letter that best describes you for each question. Remember that risk tolerance is largely subjective, so there is no right or wrong answer.

Life Stage

  1. What is your current age? 
    a) 65 or older.
    b) 60 to 64.
    c) 55 to 59.
    d) 50 to 54.
    e) Under 50.
  2. When do you expect to need to withdraw cash from your investment portfolio? 
    a) In less than 1 year.
    b) Within 1 to 2 years.
    c) Within 2 to 5 years.
    d) Within 5 to 10 years.
    e)Not for at least 10 years


Financial Resources

  1. How many months of current living expenses could you cover with your present savings and liquid, short-term investments, before you would have to draw on your investment portfolio? 
    a) Less than 3 months.
    b) 3 to 6 months.
    c) 6 to 12 months.
    d) More than 12 months.
  2. Over the next few years, what do you expect will happen to your income? 
    a) It will probably decrease substantially.
    b) It will probably decrease slightly.
    c) It will probably stay the same.
    d) It will probably increase slightly.
    e) It will probably increase substantially.
  3. What percentage of your gross annual income have you been able to save in recent years? 
    a) None.
    b) 1 to 5%.
    c) 5 to 10%
    d) 10 to 15%
    e) more than 15%
  4. Over the next few years, what do you expect will happen to your rate of savings? 
    a) It will probably decrease substantially.
    b) It will probably decrease slightly.
    c) It will probably stay the same.
    d) It will probably increase slightly.
    e) It will probably increase substantially.


Emotional Risk Tolerance

  1. What are your return expectations for your portfolio? 
    a) I don’t care if my portfolio keeps pace with inflation; I just want to preserve my capital.
    b) My return should keep pace with inflation, with minimum volatility.
    c) My return should be slightly more than inflation, with only moderate volatility.
    d) My return should significantly exceed inflation, even if this could mean significant volatility.
  2. How would you characterize your personality? 
    a) I’m a pessimist. I always expect the worst.
    b) I’m anxious. No matter what you say, I’ll worry.
    c) I’m cautious but open to new ideas. Convince me.
    d) I’m objective. Show me the pros and cons and I can make a decision and live with it.
    e) I’m optimistic. Things always work out in the end.
  3. When monitoring your investments over time, what do you think you will tend to focus on? 
    a) Individual investments that are doing poorly.
    b) Individual investments that are doing very well.
    c) The recent results of my overall portfolio.
    d) The long term performance of my overall portfolio.
  4. Suppose you had $10,000 to invest and the choice of 5 different portfolios with a range of possible outcomes after a single year. Which of the following portfolios would you feel most comfortable investing in? 
    a) Portfolio A, which could have a balance ranging from $9,900 to $10,300 at the end of the year.
    b) Portfolio B, which could have a balance ranging from $9,800 to $10,600 at the end of the year.
    c) Portfolio C, which could have a balance ranging from $9,600 to $11,000 at the end of the year.
    d) Portfolio D, which could have a balance ranging from $9,200 to $12,200 at the end of the year.
    e) Portfolio E, which could have a balance ranging from $8,400 to $14,000 at the end of the year.
  5. If the value of your investment portfolio dropped by 20% in one year, what would you do? 
    a) Fire my investment advisor.
    b) Move my money to more conservative investments immediately to reduce the potential for future losses.
    c) Monitor the situation, and if it looks like things could continue to deteriorate, move some of my money to more conservative investments.
    d) Consult with my investment advisor to ensure that my asset allocation is correct, and then ride it out.
    e) Consider investing more because prices are so low.
  6. Which of the following risks or events do you fear most? 
    a) A loss of principal over any period of 1 year or less.
    b) A rate of inflation that exceeds my rate of return over the long term, because it will erode the purchasing power of my money.
    c) Portfolio performance that is insufficient to meet my goals.
    d) Portfolio performance that is consistently less than industry benchmarks.
    e) A missed investment opportunity that could have yielded higher returns over the long term, even though it entailed higher risk.

Scoring

Give the following points for each answer: a = 1, b = 2, c = 3, d = 4, e = 5

Interpretation of Results

If your Life Stage Score is: If your Life Stage Score is: Then your Investment Time Horizon is:
1 to 3 Short-term (5 years or less)
4 to 6 Intermediate-term (5 to 10 years)
7 to 10 Long-term (over 10 years)
If your Investment Style Score is: Then Your Investment Style is:
5 to 10 Very conservative
11 to 20 Moderately conservative
21 to 30 Moderate
31 to 40 Moderately Aggressive
41 to 50 Very aggressive


The Amazon effect could still benefit the following companies

The “Amazon effect” is the ongoing evolution and disruption of the retail market, resulting in increased e-commerce. The major manifestation of the Amazon effect is the ongoing consumer shift to shopping online.

You don’t have to be a financial analyst to realize that card credit usage has gone up. Most brick and mortar retail establishments allow the consumer the choice of paying with cash, debit or credit card. Almost 90 % of all purchases that happen on line are with credit cards. Credit card companies are a popular choice because they will reverse any fraudulent purchases plus some offer extended warranties and all of them have reward programs.

The three most popular credit card cards world-wide are Visa (V), MasterCard (MC) and American Express (AXP). The chart below compares all three to Amazon over a five year period. It appears that investors think that Visa will benefit the most from the “Amazon effect”.

Keep in mind that Amazon has a rewards Visa card which earns users a rebate on all their purchases. Cardholders get 3% back for purchases made at Amazon.com, 2% cash back at gas stations, restaurants and drugstores, and 1% back on all other purchases which earns users a rebate on all their purchases.

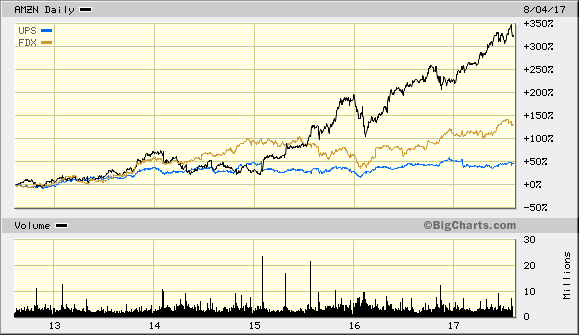
Despite news that Amazon is buying trucks and planes to better service their prime customers, delivery companies FedEx and UPS will still benefit from the “Amazon Effect.” The chart below compares these two companies to Amazon over a five year period. FedEx is by far the clear winner for investors.

While there is a glut of malls in America, there aren’t nearly enough warehouses across the U.S. to support internet retailers like Amazon. Retail sales are not in decline, but rather shifting toward e-commerce so all retailers will require large amounts of warehouse space.”

When retailers reconfigure their supply chain to accommodate the shift in consumer behavior, the requirement for warehousing space will increase substantially. This is true incremental demand and not a displacement of existing demand for warehouse square footage. Companies like Wal-Mart, Alibaba and Wayfair will also have to invest in new warehouses to try to compete with Amazon over the next few years.

Industrial REITs such as Rexford Industrial (REXR), Terreno (TRNO) and Stag Industrial (STAG) are at the top of most buy lists. Other industrial REITs that you should consider include First Industrial (FR) and Monmouth (MNR). 

Amazon’s deal for Whole Foods will likely spur a “last mile” investment by the internet giant and its competitors, Jefferies’ Petersen has predicted. “Last mile” is a reference to the warehouse that is closest to a store, a crucial point of the distribution chain that makes same-day delivery possible.

“By analyzing all of Amazon’s ‘last mile’ facilities by size and population demographics against the Industrial REIT portfolios, we found that REXR and TRNO are best positioned to serve the ‘last mile,'” Petersen said.

Then, Amazon investing in so-called secondary and tertiary markets will benefit a REIT like STAG, he added.

One of the biggest risks in owning REITs is rising interest rates. Higher borrowing costs can reduce cash flow and effect their ability to pay dividends. It also makes the financing of new projects less profitable.

A lot of the “Amazon effect” is already priced in to all of these stocks but the long term upward trend is still there.

Amazon takes a bite out of Costco & Home Depot shares, time to buy?

Both Costco and Home Depot have been regarded by money managers as “Amazon proof” until recently. Historically, these two retailing stocks have traded at very high valuations compared to other retailers.

Last month, news that Amazon was buying Whole Foods sent grocery stocks reeling. Costco, along with Kroger, Supervalu, Target and Walmart all tumbled in value. Even some European grocers like Sainsbury and Tesco sank on the announcement of the takeover deal.

Last week, Amazon said it would sell Sear’s Kenmore brand appliances. Shares of Home Depot, along with Lowe’s, Best Buy and Whirlpool were slammed. The loss of value for these stocks was about $12.5 billion. Keep in mind, with the Sears deal, Amazon will now be selling a product line that is not available at Home Depot or Lowe’s stores.

“Analysts at Robert W. Baird said the selloff in Home Depot and Lowe’s was an overreaction. The nearly $7.5 billion market cap loss in Home Depot stock equals slightly more than the amount of its annual appliance sales. Lowe’s stock loss was a little more than 50 percent of its $7 billion in annual appliance sales.”

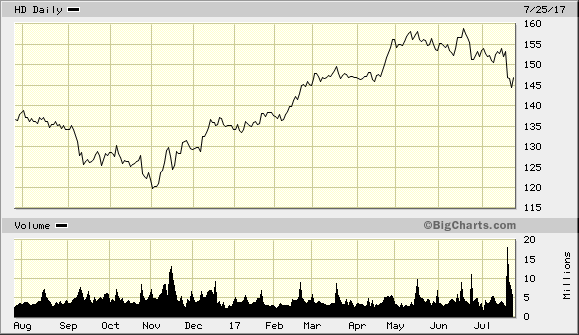
Buying premium value stocks like Costco and Home Depot when they fall is very difficult. Sometimes looking at their charts can indicate when the bleeding has stop and all the panicky investors have sold their shares.

Looking at the one year chart of Costco, you can see that buyers are coming in near the $150 price range. The 52 week low for Costco is around $142 so the downside risk is relatively small. This could be a buying opportunity if you believe that the Amazon threat has been blown out of portion.

Looking at the one year chart of Home Depot, there seems to be investor support at the $145 level but the stock could fall to the next support level which is around $135 per share. It could be too early to buy because it has only been a week since the Amazon / Sears news announcement. You could take a part position now and average down if the shares continue to fall or you could wait another couple of weeks to see if the $145 level holds.

What do you think? Are Costco and Home Depot still Amazon proof?